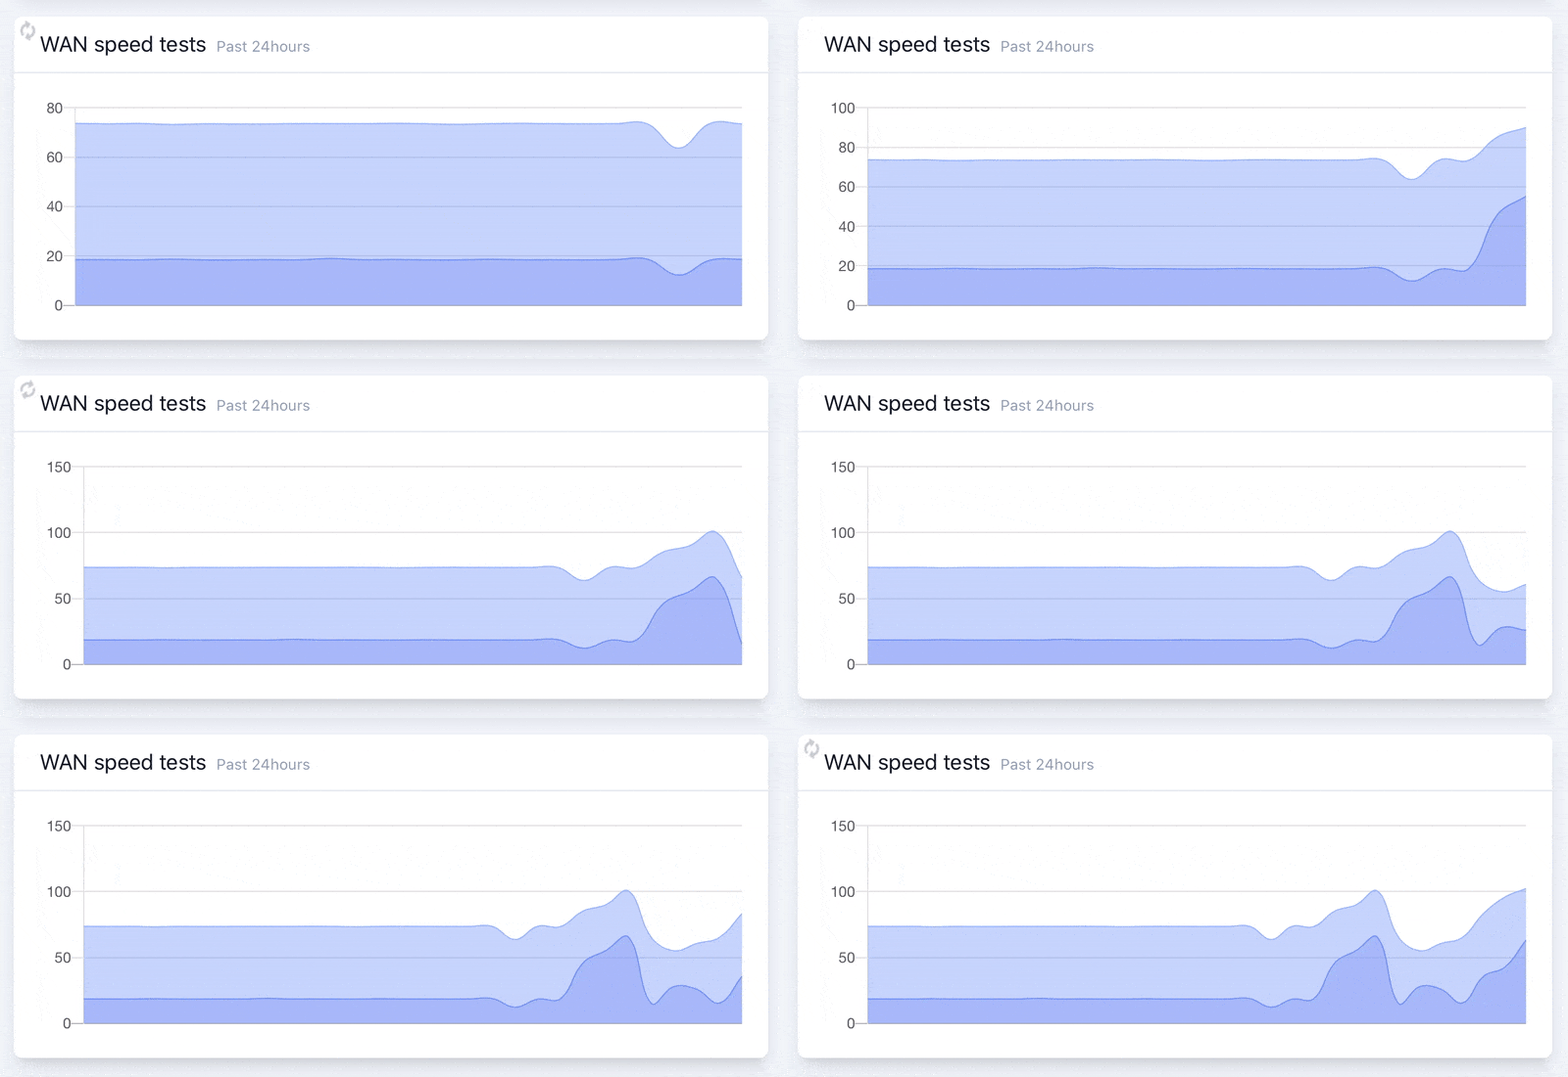
I've recently been trying out Laravel Livewire (a new JS framework for adding front-end interactivity to your Laravel applications) by updating a personal project of mine, a home network monitoring tool. This post explains how I built auto-updating ("real time") charts using Laravel Livewire and ChartJS.
Introduction
Before trying Livewire, I was using VueJS & Axios for interactive UI components such as auto-updating dashboard panels (e.g. WAN / broadband status & speeds, notifications etc) and tables of data with tools for sorting and filtering. Replacing these using Livewire has been super easy so far!
On my main dashboard there are also numerous ChartJS charts which automatically refresh every X seconds to show new any data that has arrived (e.g. WAN / broadband speed tests, number of DNS queries etc). As it's only a small side project, I'd already decided that I was happy with polling the server for updates, rather than complicating my setup by using Web Sockets.
Luckily Laravel Livewire has a polling feature built in - simply adding wire:poll.10s to the root element in the component will make Livewire update the component every 10 seconds. This works great in most circumstances, however it wasn't working with my charts as the JS had already run to initialise the chart and it wasn't recreating them.
There is nothing in the Livewire docs that covers working with charts. After doing a bit of research, I came across issue #774 in GitHub, which discussed a way of updating ChartJS instances by using Livewire events. I used this as the base idea for my implementation, but adding a few improvements.
How it works
- On the first render of the Livewire component, the initial chart data is retrieved from the database and combined with the configuration needed to render the chart, and is pushed into the blade view file as JavaScript to run on the initial page load. When viewed in a browser, the page loads, the JavaScript runs and the chart appears. The Livewire component remembers that the chart has been initially rendered by storing it's ID and a MD5 hash of the data.
- On subsequent renders of the component (triggered by the Livewire polling), the database is queried again to retrieve the data and another MD5 hash generated from it. The new hash is compared to the old, and only if it is different (meaning the data has changed), an event is emitted from the server side containing the updated dataset(s). The JavaScript then receives this event and uses the ChartJS API to update the rendered chart in the browser. The updated MD5 hash is remembered by the component for the next render.
The implementation
I'm going to use my WAN (broadband) speed tests chart as an example. There are several parts to this, so it might be a little complicated. Please feel free to contact me if you have any questions or suggestions for improving this guide.
You can find full code examples at the bottom of this post.
1) Prerequisites
I'm going to assume you already have your Laravel project setup with Laravel Livewire installed and at least a basic understanding of it (if not, read the docs!).
I'm also using the Laravel Charts library (consoletvs/charts) which acts as a nice bridge between the server-side where you data is collected / generated and the front-end where the chart is displayed. It allows you to build up everything needed for the chart on the server rather than manually in your JavaScript code. Whilst it supports many different JS charting libraries, I'm using ChartJS, which I already have included in my front end.
UPDATE 18th June 2020: I've been informed that the Laravel Charts package has had a major update (v7) since I published this article. If you want to follow along, you'll need to be using v6.*.* of the library.
2) The base classes
I have several charts on my dashboard, so to keep things as DRY as possible and to help bridge the gap between Livewire and the charts, I decided to create two new supporting classes:
- \App\Support\Livewire\ChartComponentData: a small class to hold the dataset(s) and labels for my charts. It can also perform a checksum on the data (more on this later).
- \App\Support\Livewire\ChartComponent: an abstract class that the Livewire chart components will extend instead of the base Livewire component class. It defines some abstract methods that are needed and also implements the Livewire
render()method. This is where the chart object is passed to the blade view for the first render, and where the update event is emitted (if appropriate) on subsequent renders.
3) The chart class
I've generated a class for my chart (\App\Charts\WanSpeedTestsChart) using the Laravel Charts library (php artisan make:chart WanSpeedTestsChart). I've expanded it to accept a ChartComponentData object in in the constructor and then use this to set the chart labels and datasets. It also sets options for the charts (in my case defining properties for the axes and colours for the datasets).
4) The Livewire component
Next up, it's time to generate the Livewire component using php artisan make:livewire WanSpeedTests - this creates a component class (\App\Http\Livewire\WanSpeedTests) and a blade view (resources/views/_livewire/wan-speed-tests.blade.php).
First up, the component class. It needs changing to extend the ChartComponent class that was created in step 2, instead of the base Livewire component. The abstract methods will then need implementing:
- view(): This should return the path to the view file for the component, in the usual dot notation for referencing blade views - in my case:
resources/views/_livewire/wan-speed-tests.blade.php. - chartClass(): This should return the fully qualified class name of the chart class - in my case:
\App\Charts\WanSpeedTestsChart - chartData(): This method should be used to query the database (or cache) and build up the dataset(s) and labels for the chart, returning them inside an instance of the ChartComponentData class.
Next, it's time to look at the blade file for the component. Like all Livewire components, it needs a single root element, but I've also add a polling setting to it: <div class="wrapper" wire:poll.10s></div>. You can add whatever else you like in the component (e.g. a title), but as a minimum it will need to render the chart.
A wrapping <div> for the chart is needed, with a wire:ignoreattribute. Inside that, an @if($chart) directive is needed to check we have a chart object (it will only be available on the initial render), then inside that the chart container can be rendered using the Laravel Charts library; <?php echo $chart->container(); ?>.
The JavaScript for initialising the chart will also need rendering into the page, but as I mentioned above, I only want to do this on the first render of the component. To achieve that, I've used the stacks feature in blade. In my top level view / layout file (containing the closing </html> tag), I added a blade stack directive: , ensuring it's after my reference to the ChartJS library.
Returning to the component blade file, I push the JavaScript for the chart initialisation into the stack, but like above with the chart container, I only do this if there is a chart object (i.e. only on the first render), so the push to the stack is wrapped with an @if($chart) directive again.
5) The JavaScript event listener
For the rendered chart to update when the data changes, I needed to implement an event listener in my applications JavaScript code. The update event includes the chart ID (generated by the Laravel Charts library), labels and dataset(s).
Within the event listener, I simply reference the global JavaScript object representing the chart (via the chart ID) and assign the updated data from the event to it's labels and data properties. Finally, I call the update() method on the JavaScript chart object, which will get ChartJS to re-render the chart with the updated data.
The JavaScript file containing this event listener must be referenced after the Livewire and ChartJS libraries.
6) Using the Livewire component
Finally, I just need to include the Livewire component in the blade view file for my page e.g. <livewire:wan-speed-tests/>.
Demo time!
With everything above implemented, that gave me my auto-updating WAN speed test chart on my dashboard. Here is a short preview of the chart in aciton on my dashboard (with some fake data being fed in at super-speed).

The code
The full source code is available in a Gist. This is very much tailored to my use-case, but please feel free to use this as you wish.
I hope you've found this post useful. If you've got any questions, you can find me on Twitter (@gbuckingham89) - or you can send me a message.
This has been my first longer guide / tutorial - so if there is anything that could have made this easier to digest, please let me know so I can improve!

